Outcomes · US & Canada
Visual Menu Average Check: How 3D Previews Affect Restaurant Spend (2026)
An honest look at how 3D menu previews may support higher-confidence orders and dessert upsells, with real limits and Free, $20, and $200 plans.
2026-09-19 · 8 min read · BeforeTable
What average check actually measures
Average check is total revenue divided by the number of guests or covers served in a period. It moves with pricing, staffing, weather, and other factors that have nothing to do with how a dish looks on a menu. Any honest conversation about a visual menu's effect on average check has to start there.
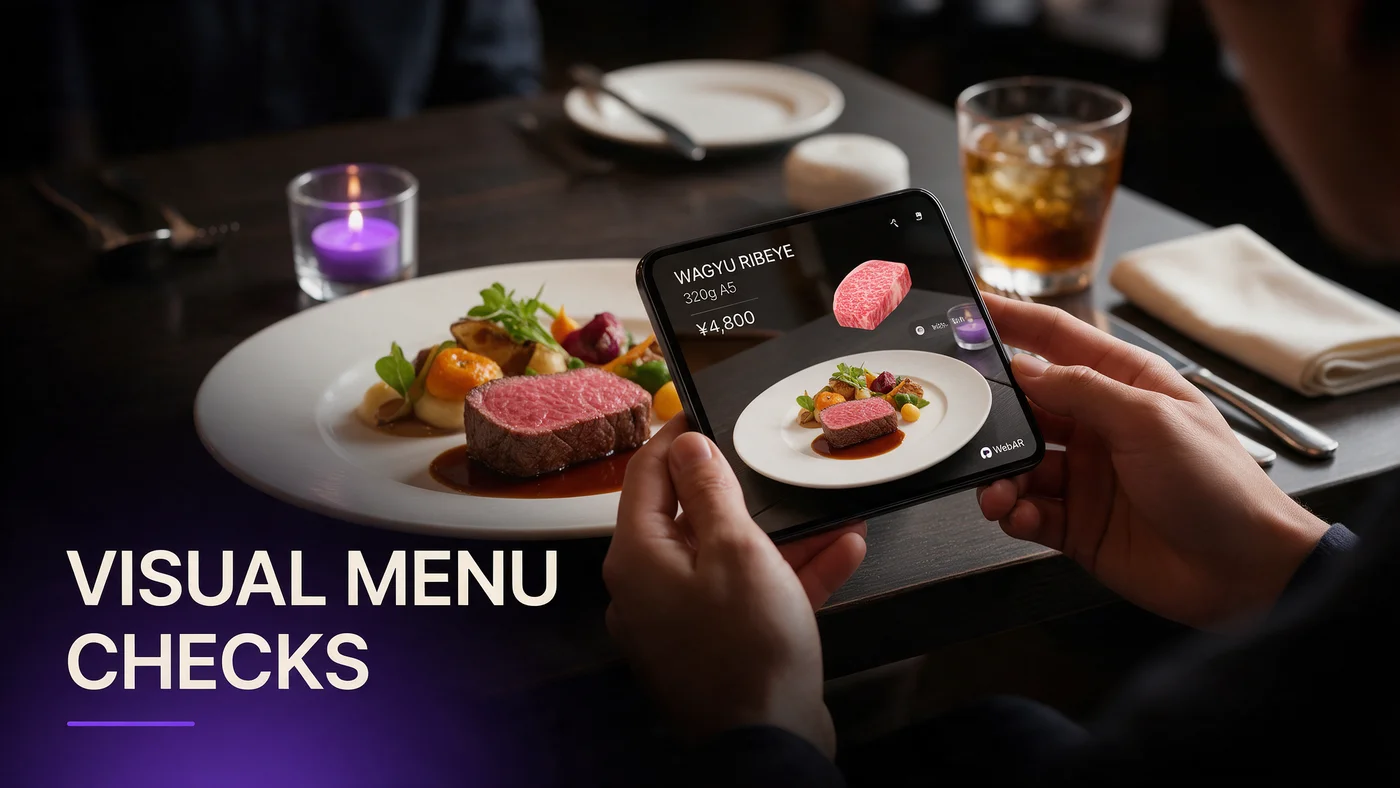
A WebAR menu, the kind a guest opens by scanning a QR code to rotate a 3D dish preview on their own phone, is one input into that number among many. It is worth knowing what it can plausibly influence, and what it cannot, before treating it as a lever for revenue.
Where a visual menu can honestly move the needle
The honest case for a visual menu rests on decision quality, not manufactured demand. A guest who sees a dish rotate before ordering is choosing with more information, not being pushed toward a pricier item. That distinction matters for how you judge the outcome.
What a 3D preview can plausibly change
A guest who sees the actual size of a shareable platter or the layers in a dessert is less likely to skip it out of uncertainty. That can support order rates on dishes guests would have ordered anyway if they trusted the description, a real but modest effect, not a guaranteed lift.
What it cannot promise
A 3D preview cannot make a guest hungrier, override a fixed budget, or turn a $12 entree into a $20 one. Treat any claim promising a specific average check increase from AR alone with skepticism, since check size depends on far more than how a menu is displayed.
Higher-confidence orders versus higher spend
Higher-confidence ordering and higher spend are related but not the same. A guest who orders confidently might still order the same $14 dish, just with less hesitation and fewer follow-up questions. That is a real benefit even when it does not show up as a bump in average check that week.
Spend can shift at the margins: a guest undecided between skipping dessert and ordering it might decide differently once both options are clear. That is a plausible, narrow effect, not a menu-wide multiplier.
Dessert upsells: a realistic look
Dessert is one of the more believable places for a visual menu to matter, since dessert orders are often impulse decisions made after the main course, when a guest is weighing whether they have room and whether it looks worth it.
Why dessert previews tend to perform well
A photo of a slice of cake tells you it exists. A rotating 3D preview shows the actual height of the layers and the portion size, which answers the unspoken question of whether it is worth ordering when a guest is already full.
Where the upsell moment actually happens
The moment matters as much as the preview. A dessert preview shown when a server would normally ask about dessert, rather than buried at the bottom of a long menu, is more likely to get looked at at all.
Side dishes and add-ons guests are already deciding on
Sides and add-ons sit close to dessert in this sense. A guest ordering a steak is often deciding between two or three sides without a strong opinion, exactly the kind of low-stakes decision a visual preview can help with.
Add-ons guests were not sure about
A guest unsure whether a $4 side is worth it, or what a sauce upgrade adds to the plate, is more likely to add it once they can see it rather than guess from a one-line description.
Why showing beats describing
Menu copy is limited by space and a guest's patience for reading. A rotating preview conveys size, sauce coverage, and plating in seconds, something a sentence of description often cannot match.
What still drives average check more than any preview
None of this replaces the fundamentals. Menu engineering, pricing, and staff suggestion still account for more of a check's size than any visual layer sitting on top of the menu.
Menu engineering fundamentals
Where a dish sits on the menu, how it is priced against similar items, and how it reads in words still do most of the work. A visual preview supports a well-built menu; it does not fix a poorly built one.
Staff suggestion and table timing
A server who mentions dessert at the right moment usually has more influence on the check than a QR code the guest might not scan. Treat AR as a supplement to service, not a replacement for it.
Picking the hero dishes worth featuring first
Since you cannot photograph and model every dish in week one, choosing the right handful matters more than the number you start with.
Dishes with real margin
Start with dishes that already carry good margin, since any effect on order rate or upsell is more useful when the dish itself is profitable rather than a loss leader.
Dishes guests already hesitate on
If servers regularly field the same questions about a dish's size or spice level, that dish is a strong candidate, since the preview answers the question before it gets asked.
Measuring change without fooling yourself
If you want to know whether a visual menu is doing anything, measure it carefully rather than assuming a change in average check proves causation.
A simple before and after comparison
Track average check and attach rate on your hero dishes for two weeks before adding AR previews, then for two weeks after, without changing prices or staffing in between.
What analytics can and cannot tell you
Growth plan analytics show how often guests open and interact with a preview, which tells you attention, not intent to buy. Pair that data with your POS numbers rather than treating views as proof of revenue impact.
Guest experience: confidence, not pressure
Guests respond better to a menu that helps them decide than one that feels like a sales pitch. A rotating preview a guest can choose to look at, or ignore, reads as helpful, which matters for how a restaurant is perceived over repeat visits, not just one check.
This is also why AR works better as something guests opt into by scanning a code than as something forced on every guest. The choice to look is part of what makes it feel like information, not a pitch.
Setting up a two week average check test
One table, three dishes, two weeks
Pick one table or a small section, add AR to three hero dishes: one dessert, one side or shareable, and one dish guests hesitate on, and run it for two weeks. Compare attach rate and average check against a comparable period before, and against tables without the preview if you can manage that split.
Common mistakes when chasing average check with AR
The most common mistake is expecting a specific percentage lift and treating anything less as a failure, when the realistic outcome is a modest effect layered on everything else already driving your numbers. A second is adding AR to every dish on day one instead of three hero items, making it harder to tell what changed.
What this costs, and how to start free
Free starts at $0 for 3 AR dishes, enough to run the two-week test above. Starter is $20 a month for 15 dishes, useful once you want AR across appetizers, mains, and dessert. Growth is $200 a month for 50 dishes with analytics, most useful once you compare attach rate across a full menu. See beforetable.com/blog/beforetable-pricing-explained for the full breakdown.
Start Free with 3 AR dishes at $0 and measure the change against your own receipts before drawing conclusions about average check. The FAQ below covers the honest limits of what a visual menu can and cannot do.
Frequently Asked Questions
Does a visual menu guarantee a higher average check?
No. It can support higher-confidence ordering and dessert or side attach rate on specific dishes, but average check depends on many factors and no reputable source can promise a fixed increase.
Which dishes benefit most from a 3D preview for upsells?
Dessert, shareable platters, and sides guests are undecided about tend to benefit most, since those are lower-stakes decisions a preview can inform.
How should I measure whether AR affected my average check?
Track average check and attach rate on your hero dishes for two weeks before adding previews and two weeks after, keeping prices and staffing steady in between.
Does Growth plan analytics prove revenue impact?
No. It shows how often guests view or interact with a preview, which is attention, not confirmed purchase intent. Pair it with your POS data.
How many dishes should I start with for a check-size test?
Three hero dishes: one dessert, one side or shareable, and one dish guests often ask questions about, run for about two weeks.
Does a visual menu replace menu engineering?
No. Pricing, placement, and description still do most of the work. A visual layer supports a well-built menu rather than fixing a weak one.
Do guests feel pressured by an AR preview?
Generally no, since guests choose to scan and view it. That opt-in nature is part of why it reads as helpful rather than a sales push.
How much does this cost to test?
Free is $0 for 3 AR dishes, Starter is $20 a month for 15 dishes, and Growth is $200 a month for 50 dishes with analytics.
Do I need the Growth plan to run a check-size test?
No. The Free plan's 3 dishes are enough to test three hero items before deciding whether to expand.
Does WebAR work without a guest app?
Yes. Guests scan a QR code and view the 3D preview directly in Safari or Chrome, with nothing to install.
How long should I run a test before drawing conclusions?
About two weeks per period is a reasonable minimum, long enough to average out day-to-day noise without waiting so long that other factors shift too.
Should staff still mention dessert and sides if I add AR?
Yes. Staff suggestion still matters more than a QR code the guest might not scan, so treat AR as a supplement, not a replacement for service.
Can AR fix a dish that already underperforms?
Unlikely. A visual preview shows a dish more clearly, but it cannot fix a dish problem rooted in price, description, or placement on the menu.
Where can I read more about pricing?
See beforetable.com/blog/beforetable-pricing-explained for the full breakdown of Free, Starter, and Growth plans.
What is the first step to test this in my own restaurant?
Start Free with 3 AR dishes at $0, pick your hero dessert, side, and entree, and compare your own receipts over two weeks.